Economy U13
AI Analysis of UK Firms’ Pricing Reports Maps Inflation Pressures
An AI review of 66,820 company reports traces changing price drivers, from weak demand after the financial crisis to recent cost pressures.
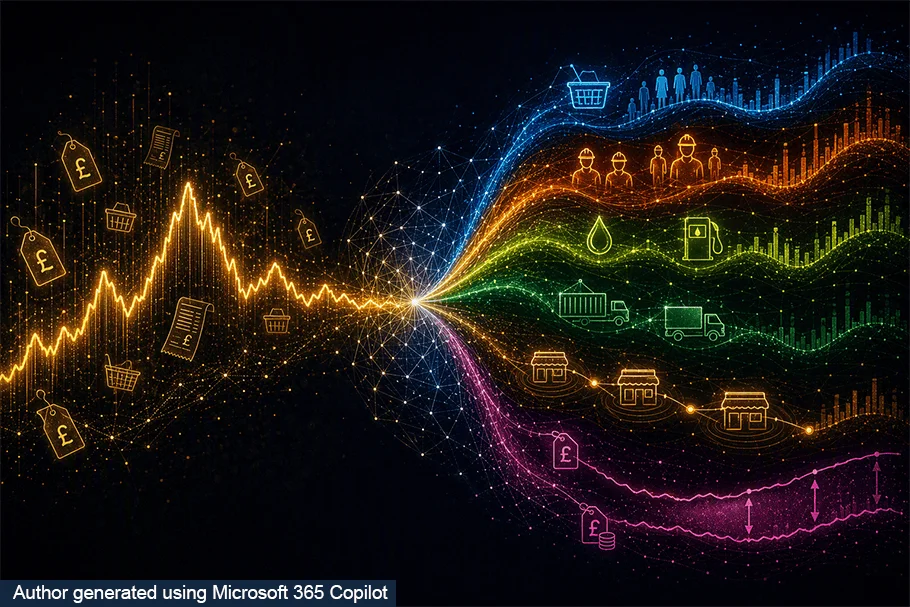
Firms’ explanations for changing prices can show how an inflation shock travels through the economy. A new analysis uses an artificial intelligence model to extract those explanations from company visit reports, tracing the roles of costs, wages, demand and pricing decisions. The results suggest that cost pressures associated with the recent Middle East conflict have so far been narrower than those recorded during the 2021–23 inflation surge.
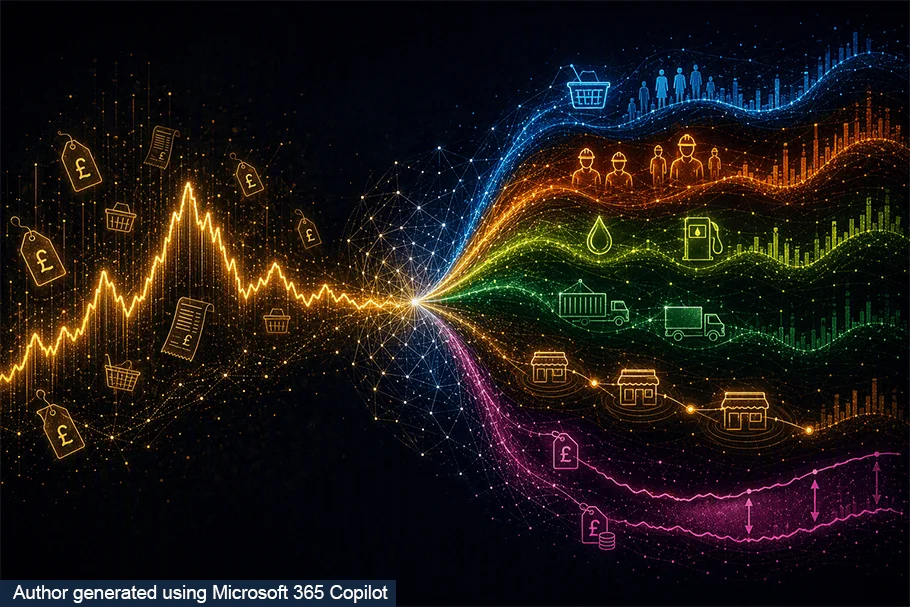
The research by Marcus Buckmann, Galina Potjagailo and Shobhit Rawat applies a large language model (LLM) to reports of discussions between Bank of England staff and companies across the United Kingdom. These reports offer qualitative evidence about how firms see demand and costs, and how they set prices. Turning that material into consistent measures makes it possible to compare firms’ accounts across sectors and over time.
Turning company accounts into measures
The dataset contains 66,820 reports dated from January 2005 to September 2026, averaging around 260 reports a month. The researchers use a random third of reports through 2025 and the full set for 2026. Coverage has eased to 237 reports per month in 2026. Reports discuss 2,000–3,000 firms a year, with manufacturers and medium-sized businesses somewhat more represented than in the UK business population.
The source material has also grown. Median report length rose from 585 words in 2005 to 1,254 words recently, giving the model more detail to work with in the later years. Each report combines information about a company, such as location, employment and turnover, with notes on subjects including prices, wages, costs, margins, investment and demand. Staff also assign scores to firms’ assessments; the LLM provides a systematic measure derived from the written accounts.
For each report, the model scores reported and expected changes in output prices over the past and next three to 12 months, relative to normal conditions. It then attributes the explanations to six categories: direct energy costs; indirect input costs transmitted through supply chains; labour costs; demand; margin adjustments, including whether firms absorb or pass on higher costs; and strategic complementarities, where a company responds to competitors facing similar pressures. Any contribution that cannot be assigned to those categories is classed as unattributed.
The model is instructed to assign a factor only when the report explicitly connects it to the firm’s pricing decisions. A mention of wage changes, for example, does not count as a labour cost contribution unless the report says those changes affected prices. Reports without enough pricing information are left out. The remaining report-level scores and contributions are averaged to produce monthly and sector measures.
This approach differs from methods that count words or produce a single stand-alone score: it aims to capture why firms say prices are changing. The researchers compare it with work that extracts inflation narratives from newspaper articles and with Reserve Bank of Australia analysis using dictionary methods. They describe the output as a measure of firms’ accounts, rather than a direct estimate of the structural causes of aggregate inflation.
Signals across earlier inflation episodes
The model’s realised price score broadly tracks UK consumer price inflation, though it moves more sharply from month to month. It also correlates closely with the scores assigned by Bank staff. At some turning points, including 2016 and 2021, the LLM measure turns earlier; it also recedes faster after peaks, particularly in 2023. The unexplained share is larger after the global financial crisis and during the recent inflation episode.

The decomposition offers a distinct account of earlier periods. After the global financial crisis, weak demand weighed on prices, followed by downward pressure associated with strategic pricing and unattributed factors. Labour costs also restrained prices during the recovery that followed. In 2014–15 and during the Covid-19 pandemic, lower global oil and commodity prices appeared in the reports as weaker indirect cost pressures, although the pattern was less pronounced than in consumer price inflation.
After the Brexit referendum, company accounts pointed to rising non-labour costs and a larger unattributed component. The authors suggest that heightened uncertainty may help explain the latter. That category matters: it captures parts of firms’ explanations that the model cannot confidently place among its defined drivers, and it grew in some periods when the narratives were harder to parse.

The 2021–23 episode began with broad direct and indirect cost pressures, alongside strong demand. Margins and strategic pricing made smaller contributions at first. In 2022–23, labour costs and pricing behaviour became more prominent, especially among service providers, even as demand weakened. By 2024–25, labour costs were the main upward driver in the accounts, coinciding with announced increases to the National Living Wage and employers’ National Insurance contributions.
Splitting the data between goods producers and service providers helps show how the same period differed across businesses. The researchers rescale the measures against goods and services consumer price inflation separately. Their account points to stronger service-sector price persistence through wage costs, margins and strategic pricing, while goods producers’ narratives reflect a different mix of cost pressures.

Recent costs and firms’ expectations
More recent reports show a temporary rise in direct cost pressures associated with the Middle East conflict, followed by some increase in indirect costs. The authors say both remain much more muted than during 2021–23. Weak demand and subdued labour cost pressures have accompanied the recent cost changes. Among service firms, margins and strategic pricing continue to support prices, suggesting some capacity to pass through costs. Compared with 2022–23, weaker wage pressure may leave more room for firms to absorb some of them.
Expectations offer another view of how a shock could develop. The model separately scores expected price changes over the next three to 12 months and their stated drivers. Past and expected contributions generally move together. That may reflect both the difficulty of separating past from future developments in company discussions and a tendency among contacts to extend current conditions into their expectations.
The largest gaps appear around major shocks. Early in 2021, expected price pressure strengthened ahead of realised pressure, especially for direct and indirect costs and margins. Since the Middle East conflict began, direct cost pressure has risen more sharply in expectations than in reports about realised changes, and remains elevated. A temporary increase in expected indirect costs also appears to be feeding into realised pressures, but on a much smaller scale than in 2022–23.

The researchers plan to examine whether expected pricing narratives provide an early signal for inflation. For now, the difference between expected and realised accounts is useful context, but the method does not establish that expectations lead subsequent price changes. The measures can also be affected by how completely reports distinguish what has happened from what firms anticipate.
Checks against economic indicators
Two comparisons support the economic meaning of the model’s categories. Its direct energy cost contribution tracks UK consumer price energy inflation. Its demand contribution aligns with a Bank of England staff estimate of the UK output gap, based on a state-space model. Because output-gap estimates are uncertain in real time, the firms’ own reported demand pressures may provide a complementary signal.
These comparisons do not make the LLM decomposition a direct measure of aggregate inflation causes. They show that categories drawn from company accounts move in ways consistent with established indicators, while preserving information about how firms describe their own decisions. The distinction is useful when aggregate price data reveal the change but offer less insight into its transmission across businesses.

The findings make company reports more usable as a timely source of economic evidence. The current pattern points to direct costs as the main recent pressure, with limited signs so far of the wider wage and supply-chain propagation seen in 2021–23. Whether that distinction holds will depend on how costs, demand and firms’ pricing decisions evolve in later reports.
Marcus Buckmann works in the Bank’s Advanced Analytics Division, Galina Potjagailo works in its Monetary Policy Innovation Lab, and Shobhit Rawat works in its Agency Network.